Historical Analysis: Charts & Table
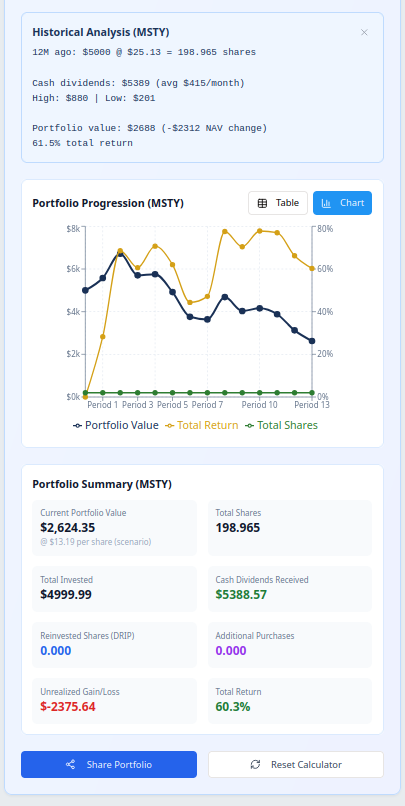
One click historical analysis by selecting a predefined period (1M, 3M, 6M, 12M) a user is able to get historical analysis.
In the screenshot, for a $5000 investment 12 months ago, the principal has an unrealized loss of $2375.64 but a cash dividend received of $5388.57 (house money to some).
